The default landing page of Yavin is the start of your data exploration. The Directory view carries all the active reports (individual data visualizations) / Dashboards (a group of related reports) that you have previously created..
Within the Directory view you can:
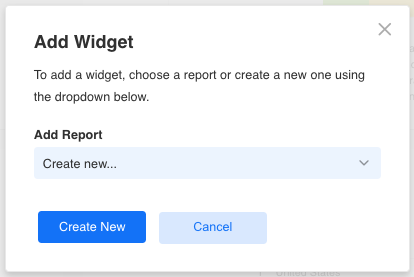
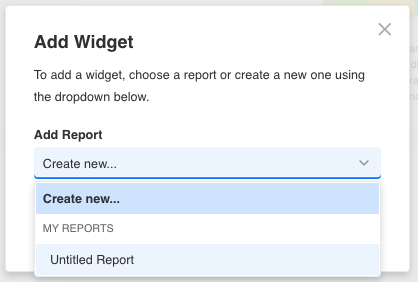
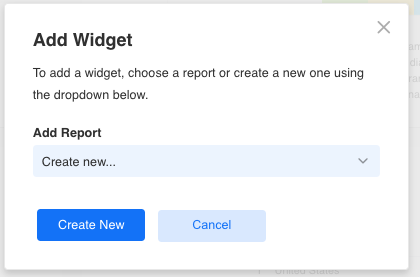
Create new Reports & Dashboards
Filter based on your Favorites Reports & Dashboards
Search for specific a Reports or Dashboards
Filter by Reports or Dashboards
Perform actions on a Report or Dashboard (Clone, Share, Delete)
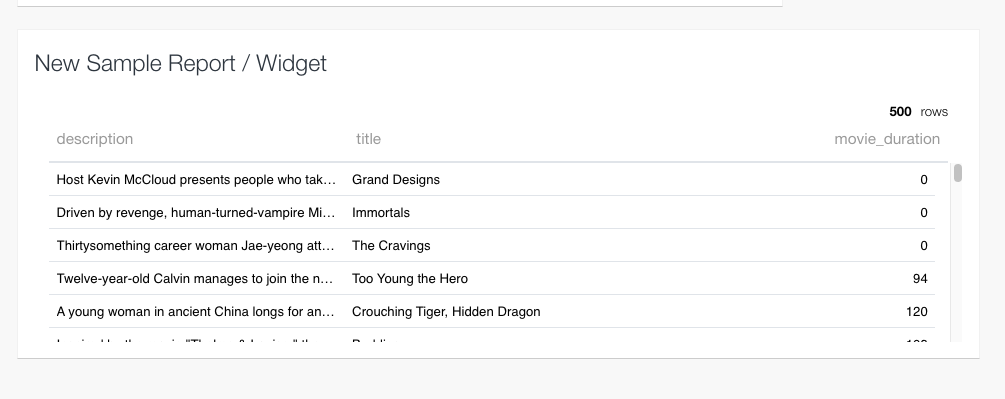
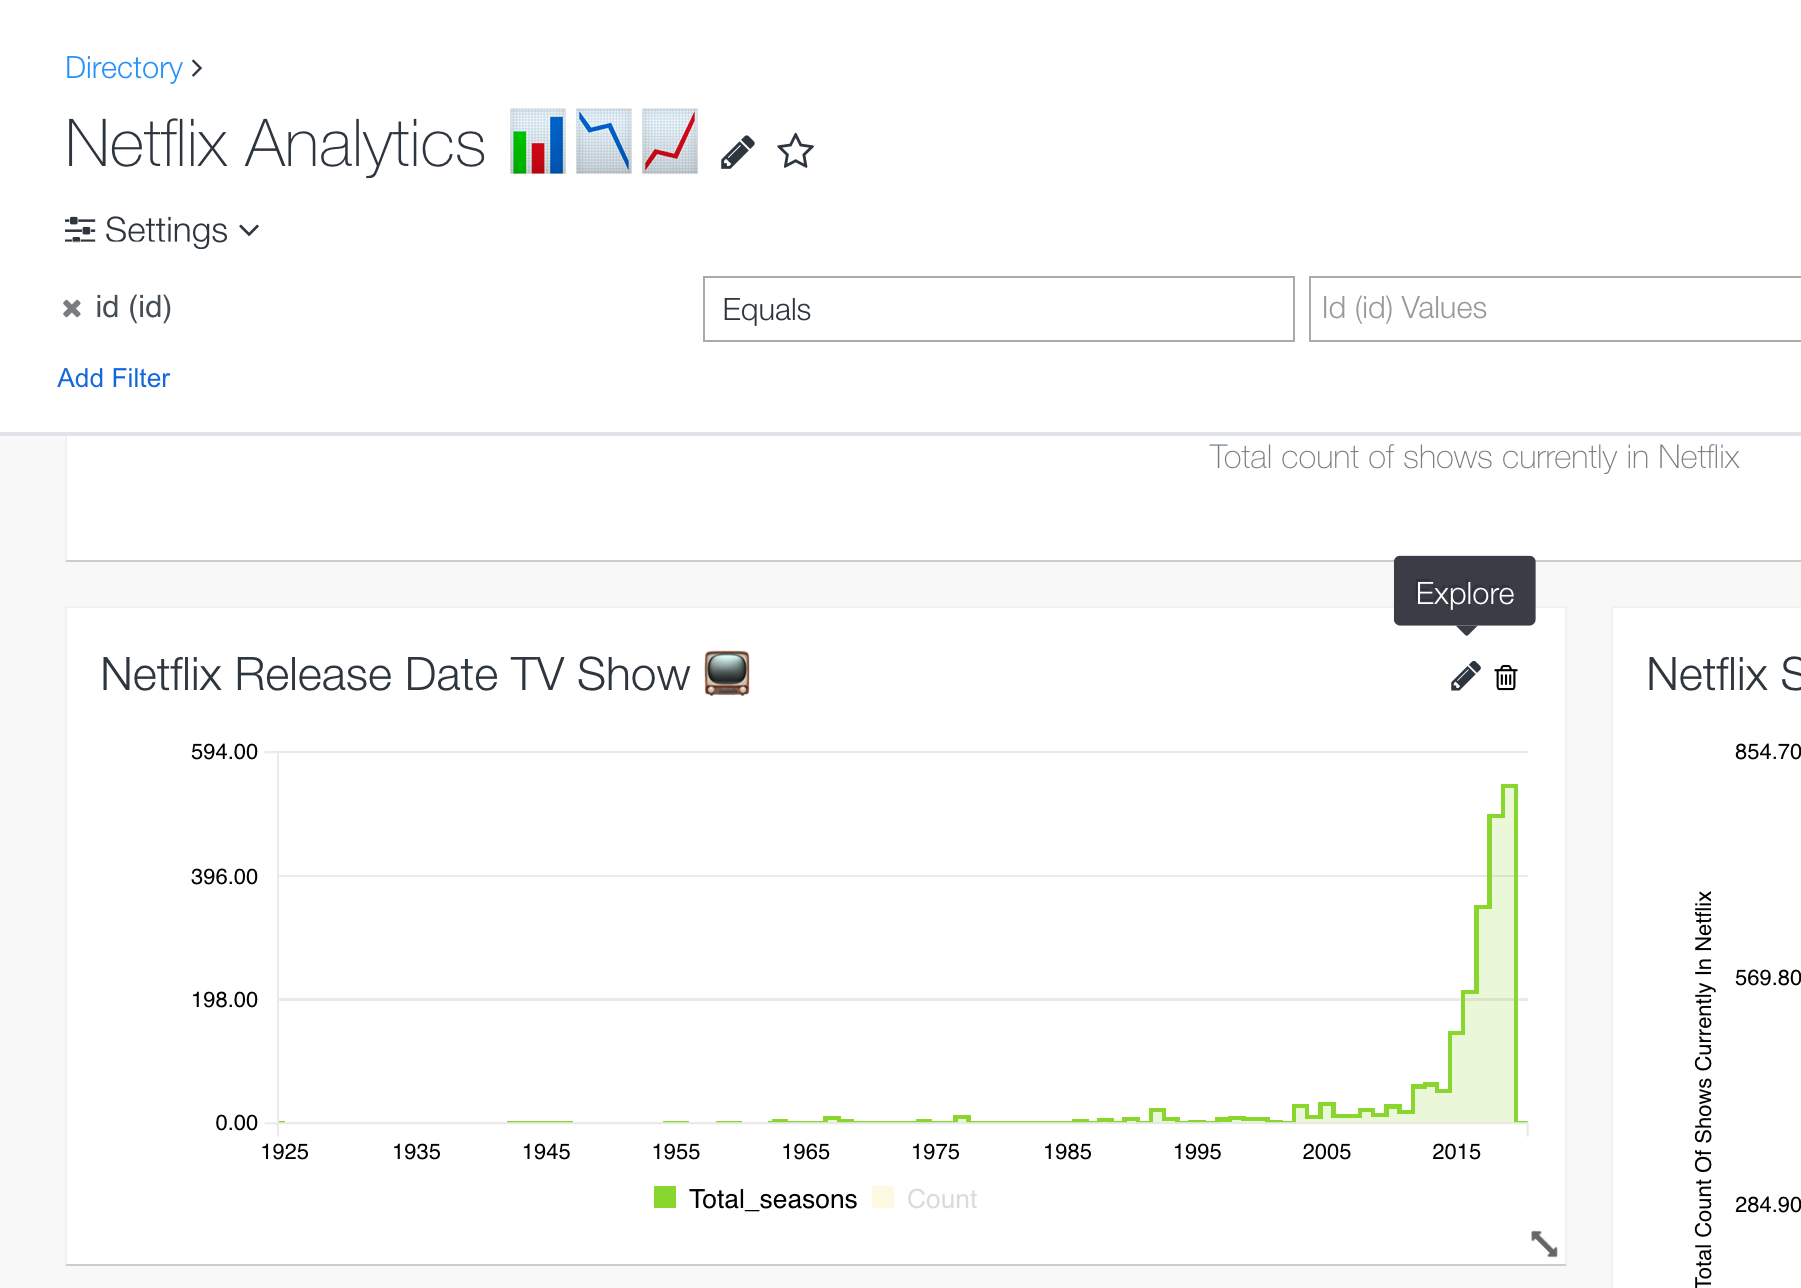
A report is a user defined query coupled with a visual representation (table, graph, etc) of the returned query result. With a report, you can freely explore the various dimensions and measures of your data. Shown below is a line chart visualization from a report showing the “Netflix TV shows release dates”, filtering only for TV shows, and release date equal to 2014. With “Release Date” as dimension and “Total Seasons” and “Count” as measures.
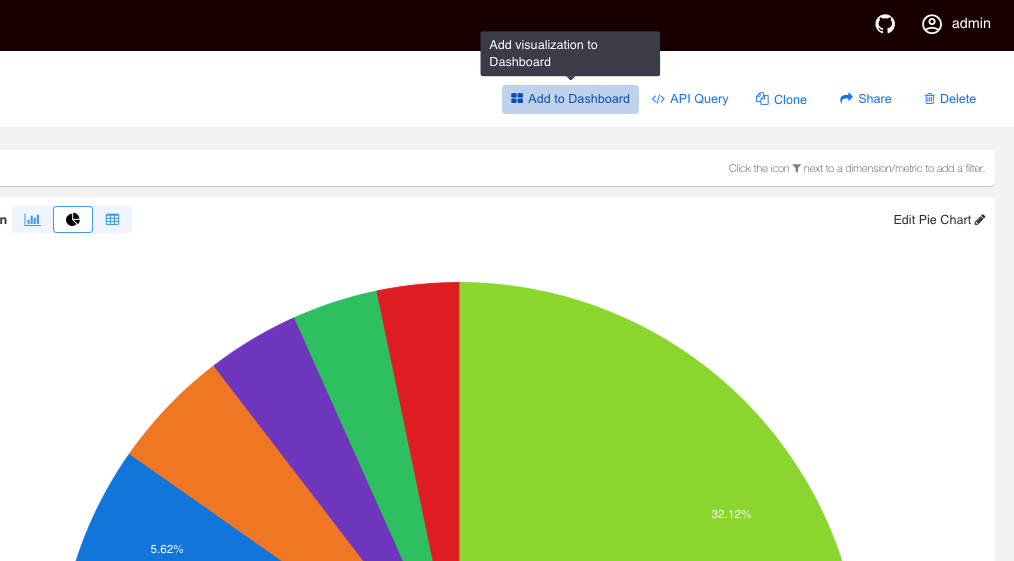
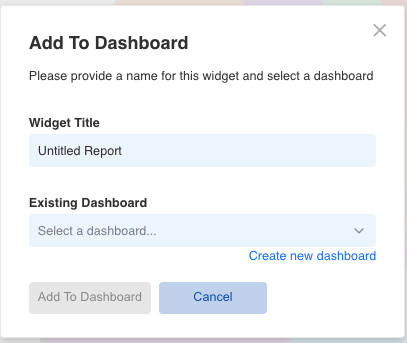
From within the report you have multiple options. Each option is shown with its associated screen icon. You can do any of the following:
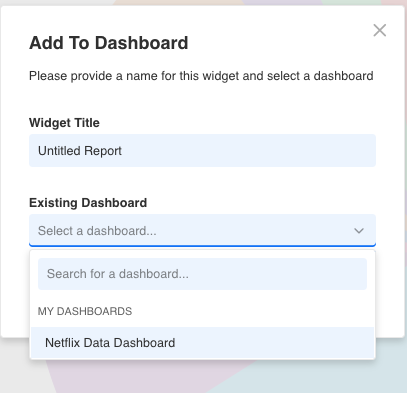
You can rename, add to favorite, add to dashboard, copy API query, clone, export, share and delete.
Operation
Availability
Rename
Now
Add to Favorite
Now
Now
Now
Now
Q1 2021
Now
Now
All operations are associated with a tooltips guide:
Tooltips Are Available On All Actions
At any time in a report, you can perform one of the following operations : Run, Save, Save As, Revert
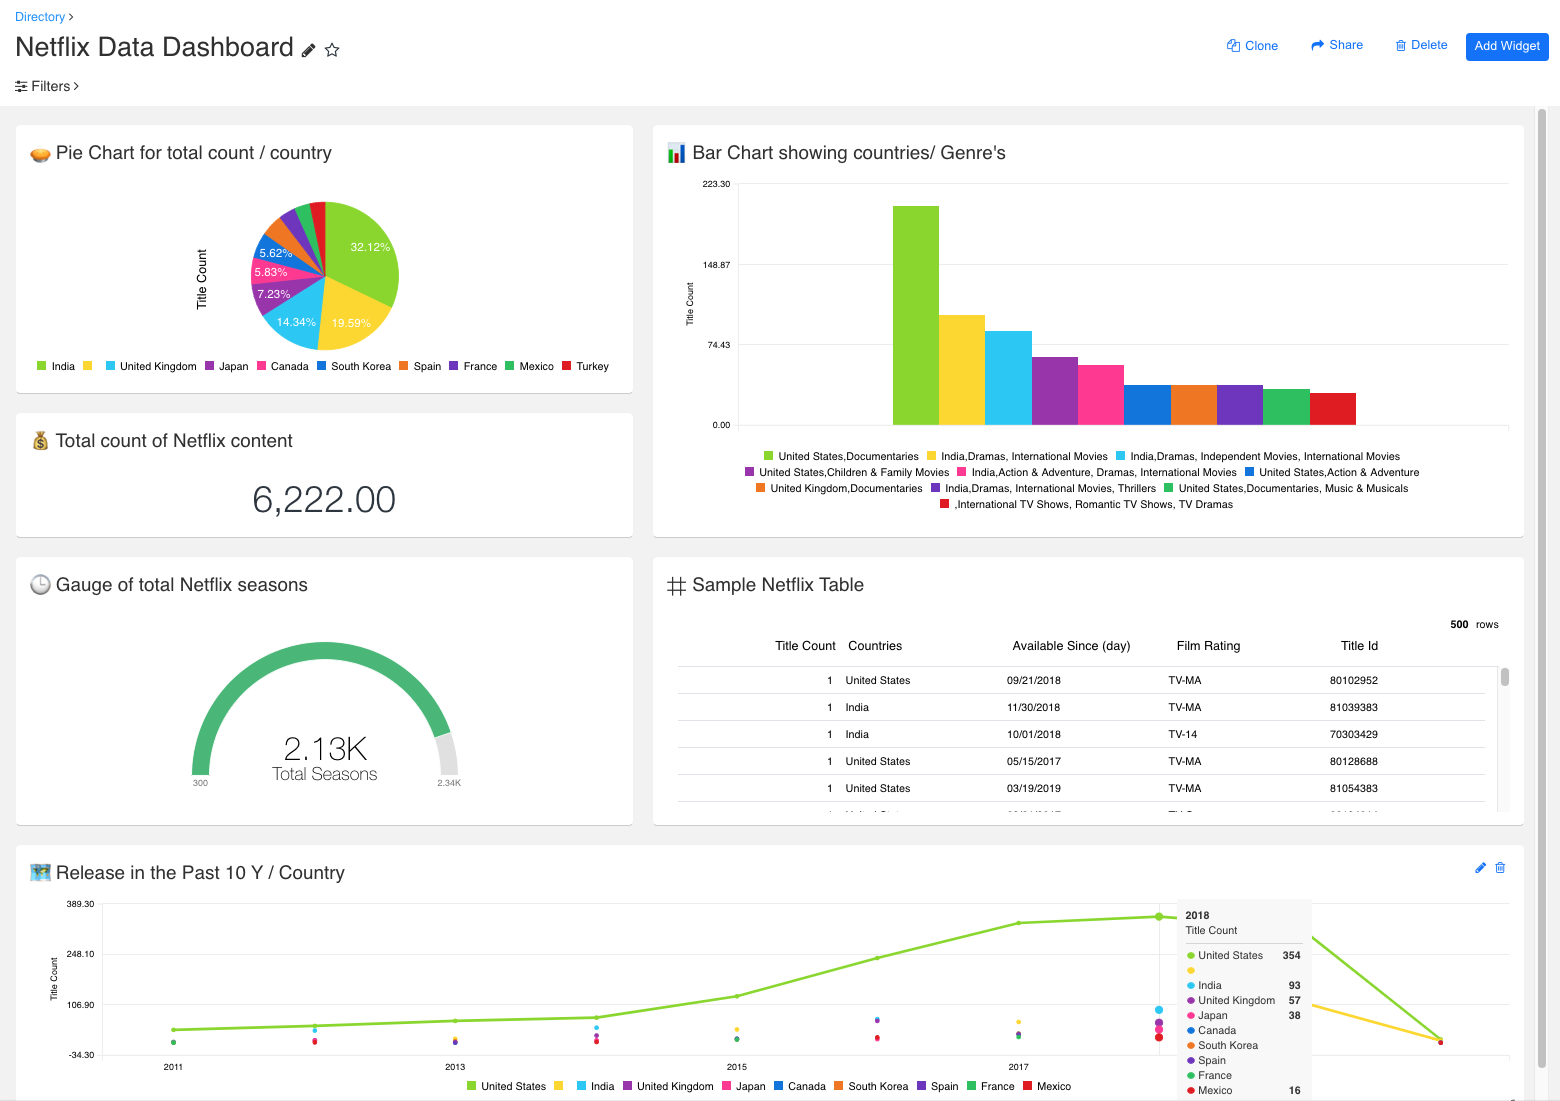
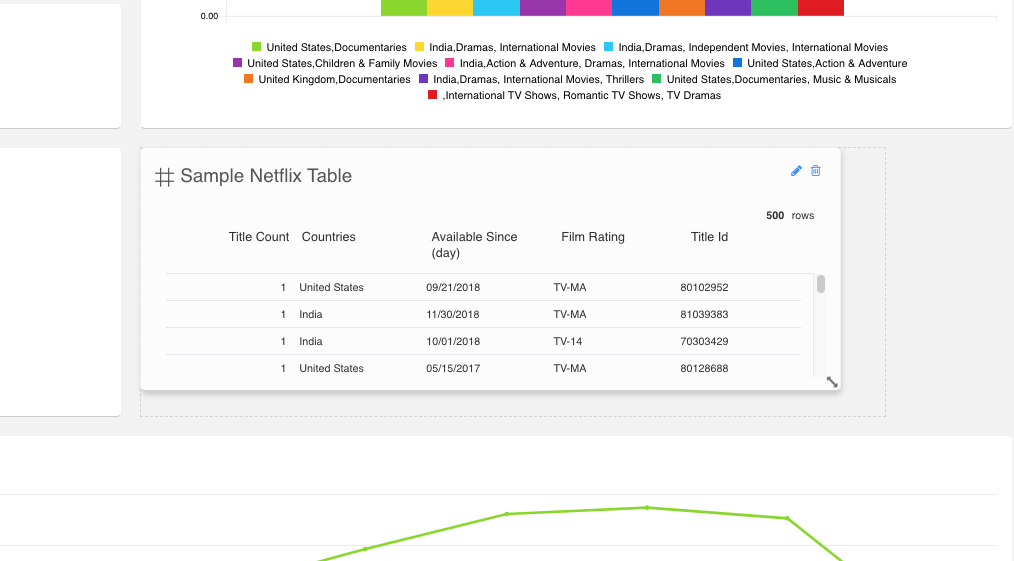
Yavin lets you take multiple reports and organize them into a dashboard, combining different visualizations. Dashboards allow you to position and size the individual reports as you desire. They are useful when your user may need to compare various reports or take multiple views of data into account.
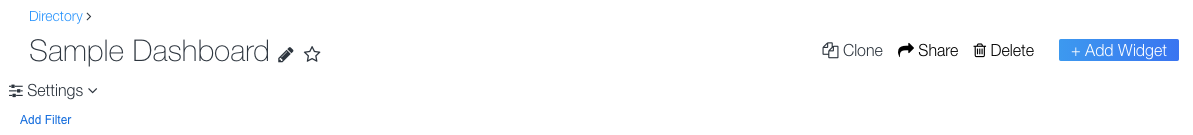
Yavin Dashboard View
From within a Dashboard, you can do all of the following. The on-screen icon is shown beside the command:
Operation
Availability
Rename
Now
Add to Favorite
Now
Now
Now
Now
Now
Now
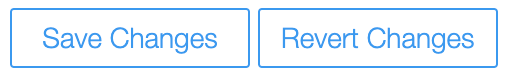
At any time in a dashboard, you can perform one of the following operations : Save Changes, Revert Changes
The reports/widgets in a dashboard can be organized, resized, explored, filtered and edited to align with how you want the Dashboard to look. Reports in a Dashboard can be edited by clicking on the pencil icon in the header of the widget/report. This will activate the edit mode for that report. Reports in a dashboard can also be resized, re-arranged and deleted.
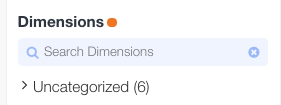
Dimensions is a primary concept when exploring your data. Dimensions are attributes and characteristics of your data. For example, in the domain of web analytics, dimensions might include properties of your website users: gender, age, location, etc. Dimensions can be used to partition your data into slices, and to focus on a specific slice using filters. In Yavin, dimensions live in the dimension panel in the report. They can be searched by, filtered by and added to the report for insights and reporting.
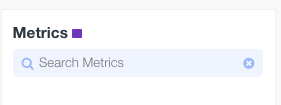
Measures, also known as metrics, provide a numeric value associated with one or more dimensions. Yavin has the ability to represent any aggregate computation supported by your database as a measure. Common examples for measures include counting, summing, averaging, or taking ratios of columns in your data. Measures live in the Metrics Panel in the report. They can be searched for, filtered by, and added to the report.